WE CREATED this project for CSIS as the first comprehensive tracker and online catalog of every maritime conflict occurring on the South China Sea. The CSIS team manually collected and recorded detailed reports as published by China, Taiwan, Indonesia, Vietnam and the Philippines. The incidents involve everything from fishing boats to military ships with a variety of outcomes that become increasingly deadly. Our job was to create an interactive design to house all the data surrounding every individual incident since 2011.
THE GOAL of the project was to give users a quick, bird’s eye view of a complex and constantly-evolving political situation while encouraging them to explore this rich collection of original data. We began by creating an interface with a quick view timeline, a detailed report card with severity labels, visual representations of the actual ships, and an account of each event by all participating parties.
An additional challenge required us to create a back-end that the CSIS team could update on the fly whenever a new incident occurred without going into the code. Editing a data file was out of the question, as this was usually the job of their interns who had no background in coding or databases. Due to the sensitivity and complexity of the issue, we needed to create a foolproof system that could be updated by anyone on the team. To accomplish this feat, we hooked into the Google Docs API and created a custom interface for a user to add a new event to the timeline by simply inserting a row on a spreadsheet.
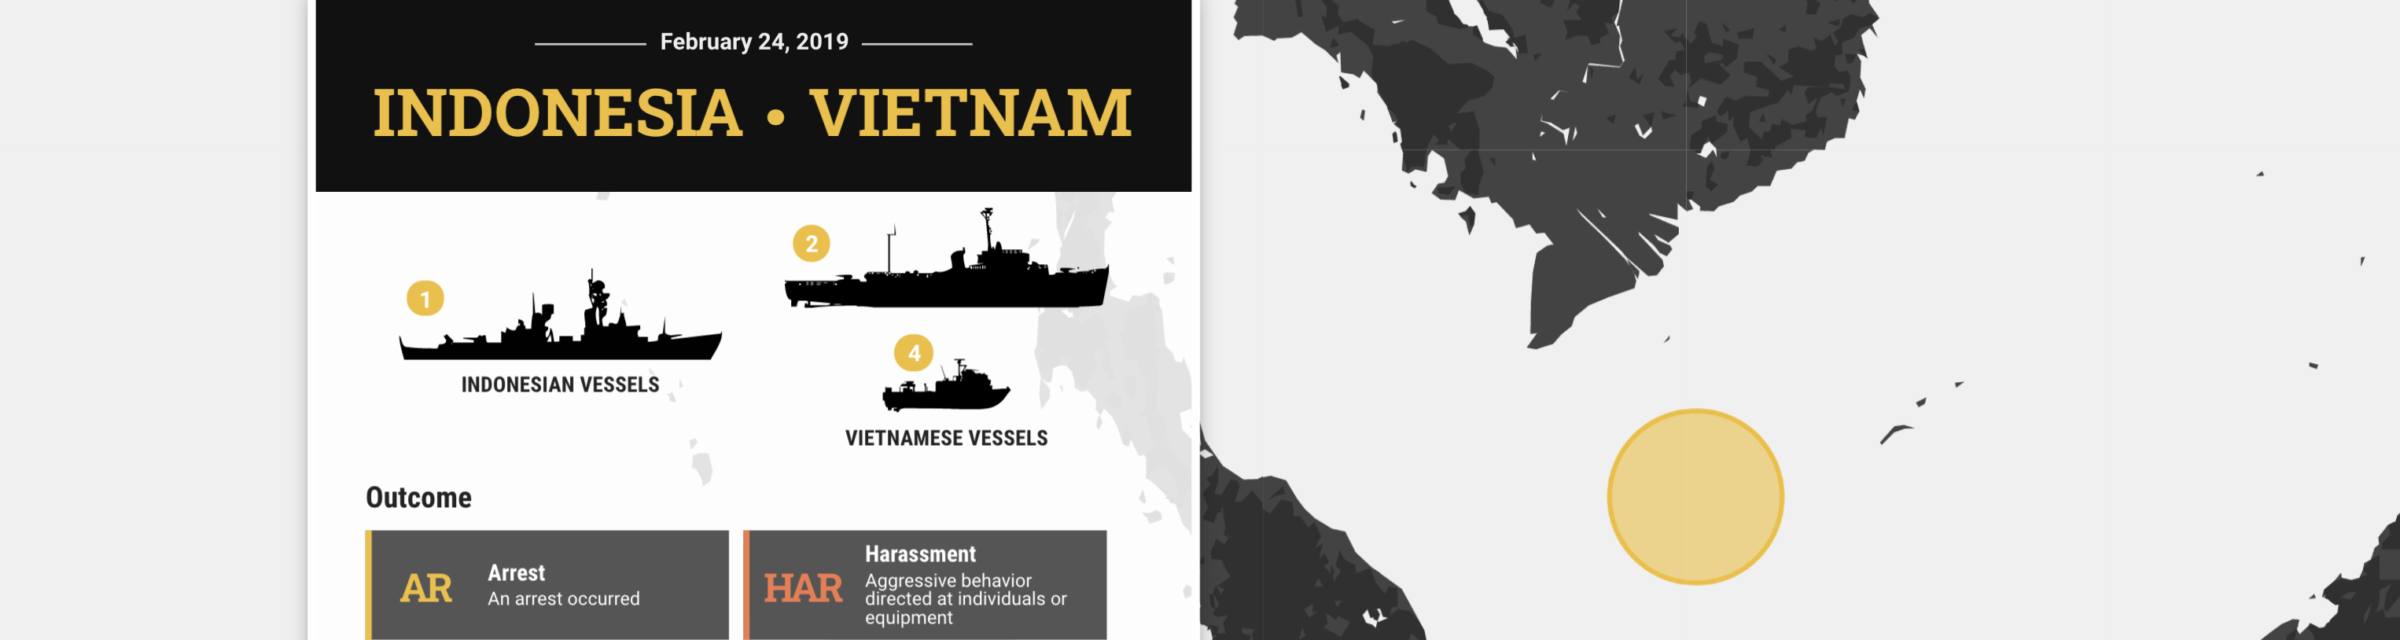
This interactive is the first comprehensive tracker of the conflicts in the South China Sea, recording details the range from conflicting country reports to the tonnage and ship model involved
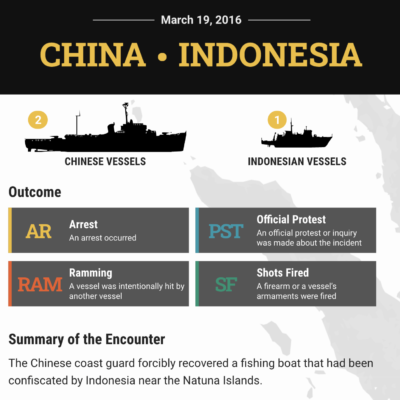
WE DESIGNED a custom timeline at the top of the interactive that served as a mini data visualization of the number of incidents and also a means to navigate each incident report card throughout the year. To classify each incident, we came up with a system of visual labels for incident types, such as “harassment,” “shots fired,” or “ramming” with custom icons, as well as representations of the ships to show the visual differences in the vessels involved with details including their hull number and tonnage. At the bottom of each report card we included a brief summary of the incident as reported by each country, which often revealed very different accounts of the event.

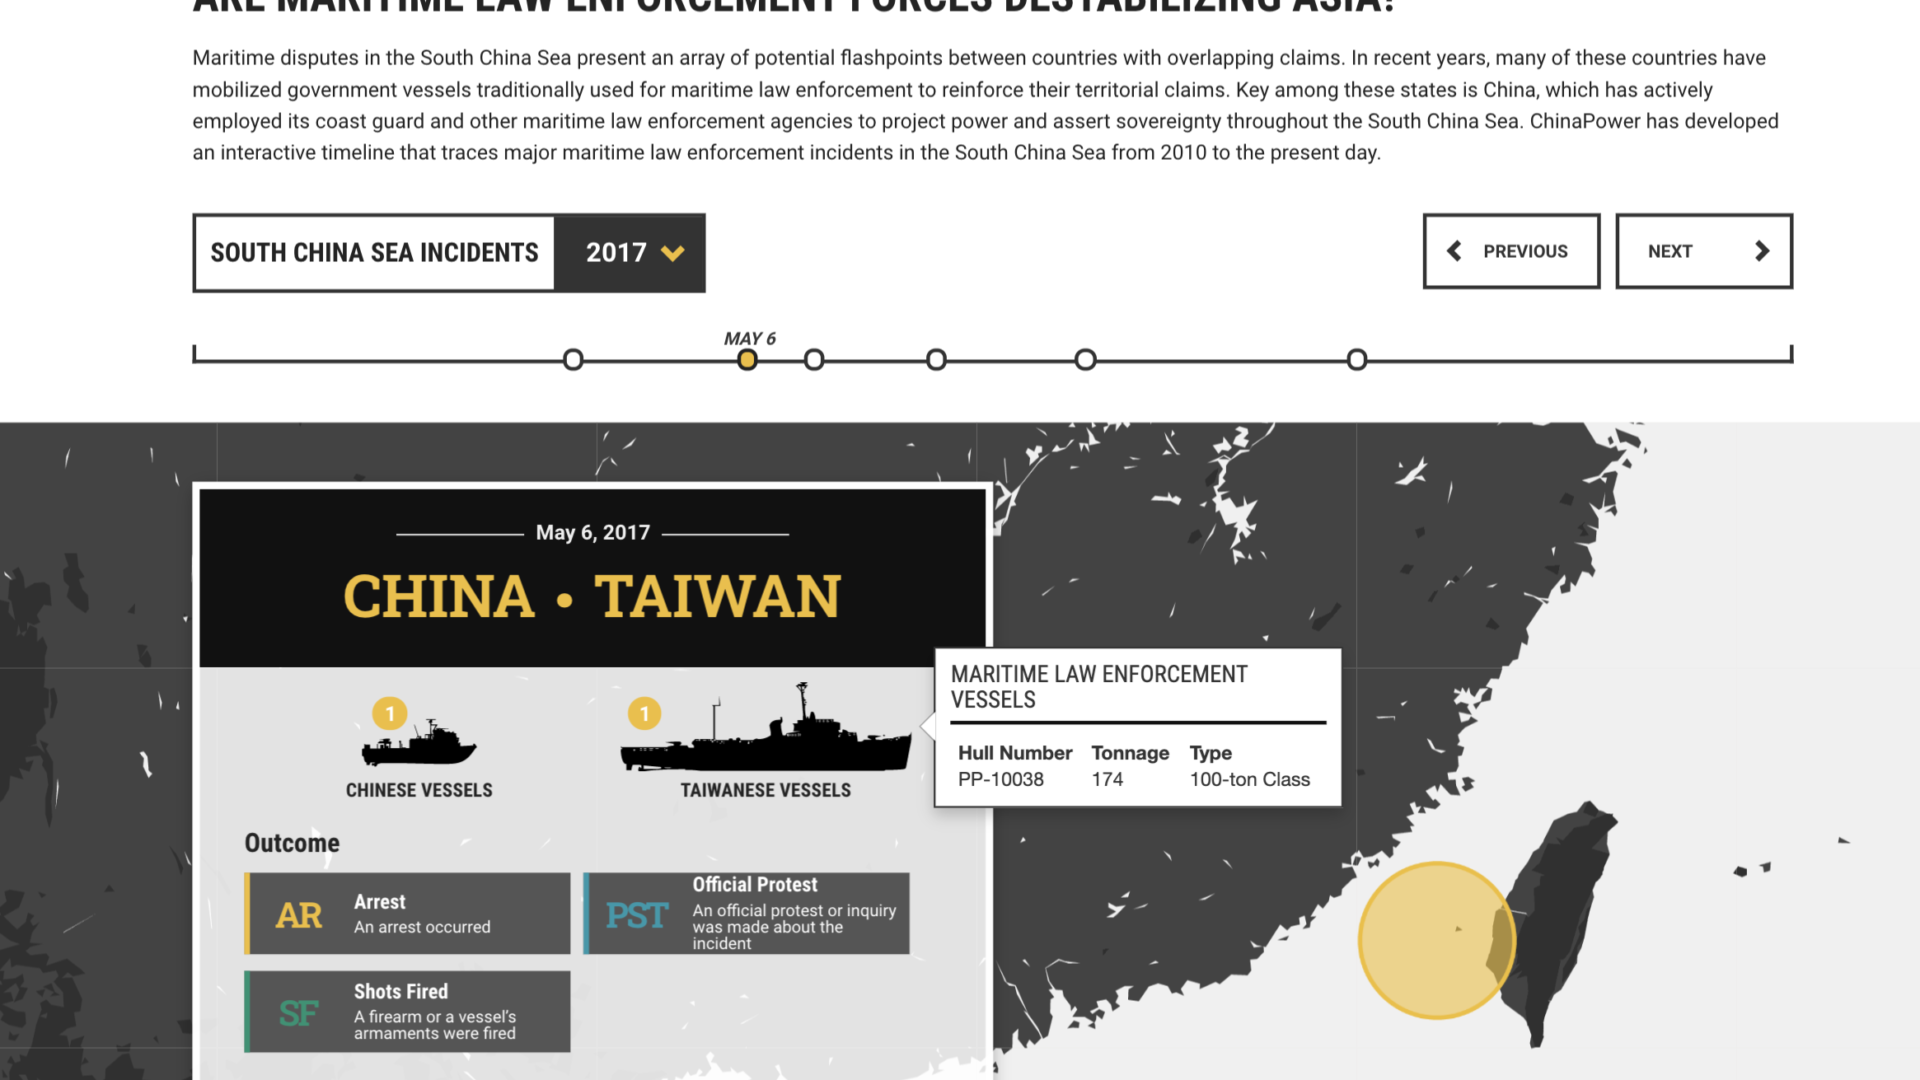
THE SOUTH CHINA SEA IS a controversial and sensitive political region where surrounding Asian countries are vying for ownership and control. Tensions have escalated enormously with incidents happening regularly, however there is no comprehensive record of all the conflicts. This interactive provides the first visual representation of every dispute, while allowing users to scroll through past years to discover trends and ultimately draw their own conclusions.