DEFENSE SPENDING GIANTS IS an interactive data visualization for CSIS’s China Power series exploring how China’s military spending has been growing steadily for the past 10 years, outpacing its neighbors and catching up to the U.S. CSIS approached SMM to design an interactive comparing China’s defense spending with other key countries over time using data from the SIPRI Military Expenditure Database.
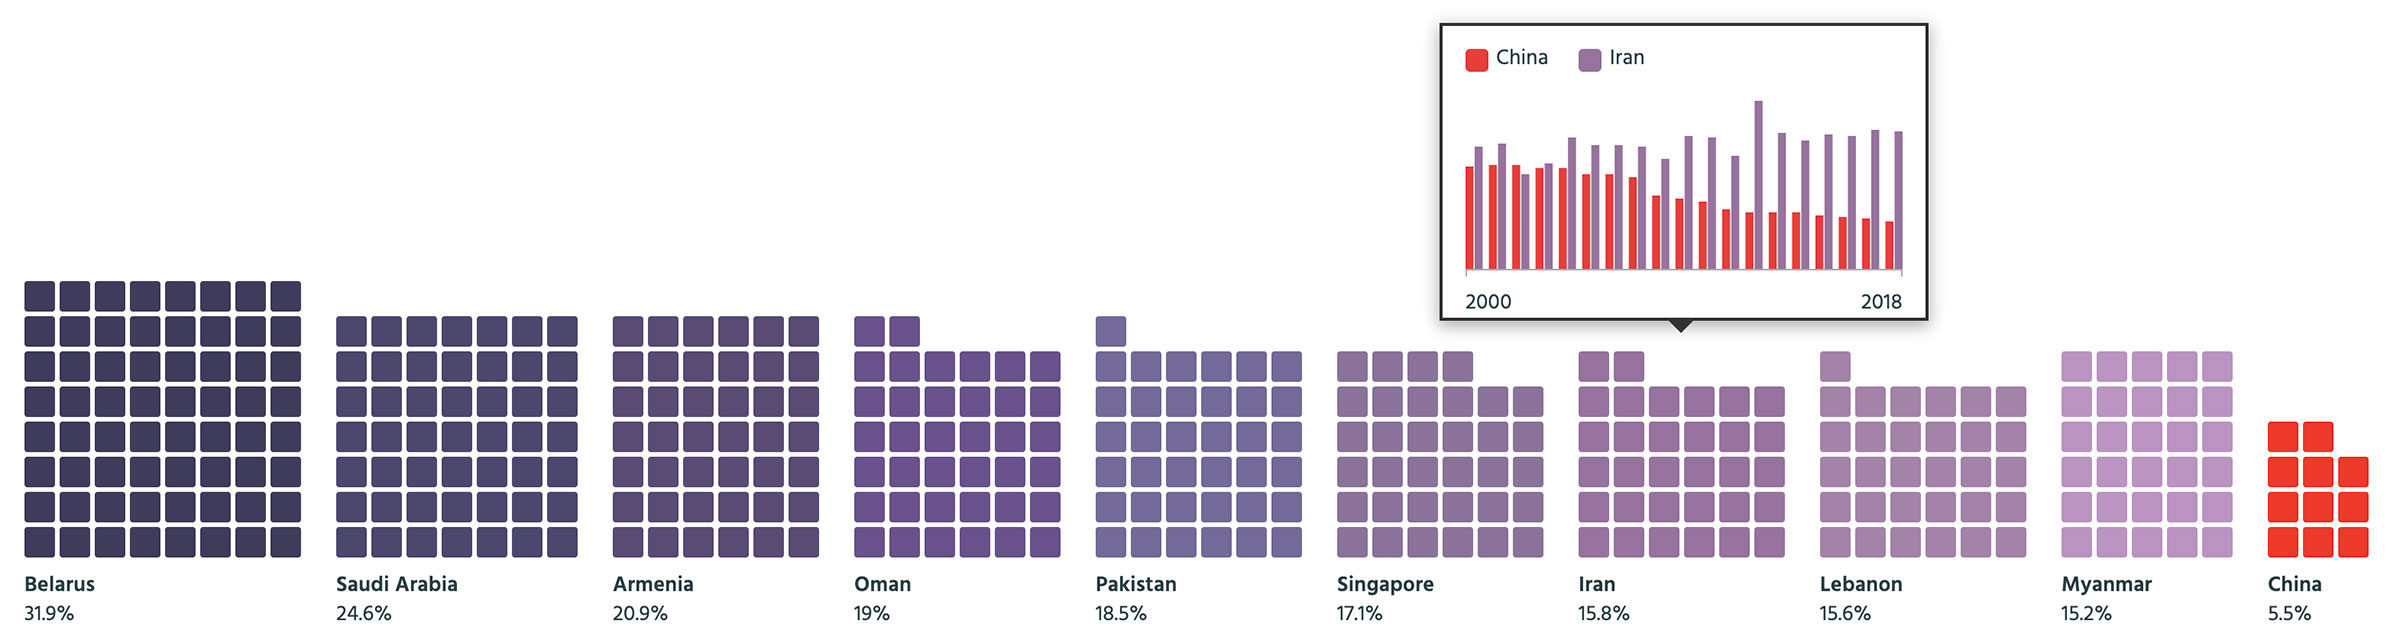
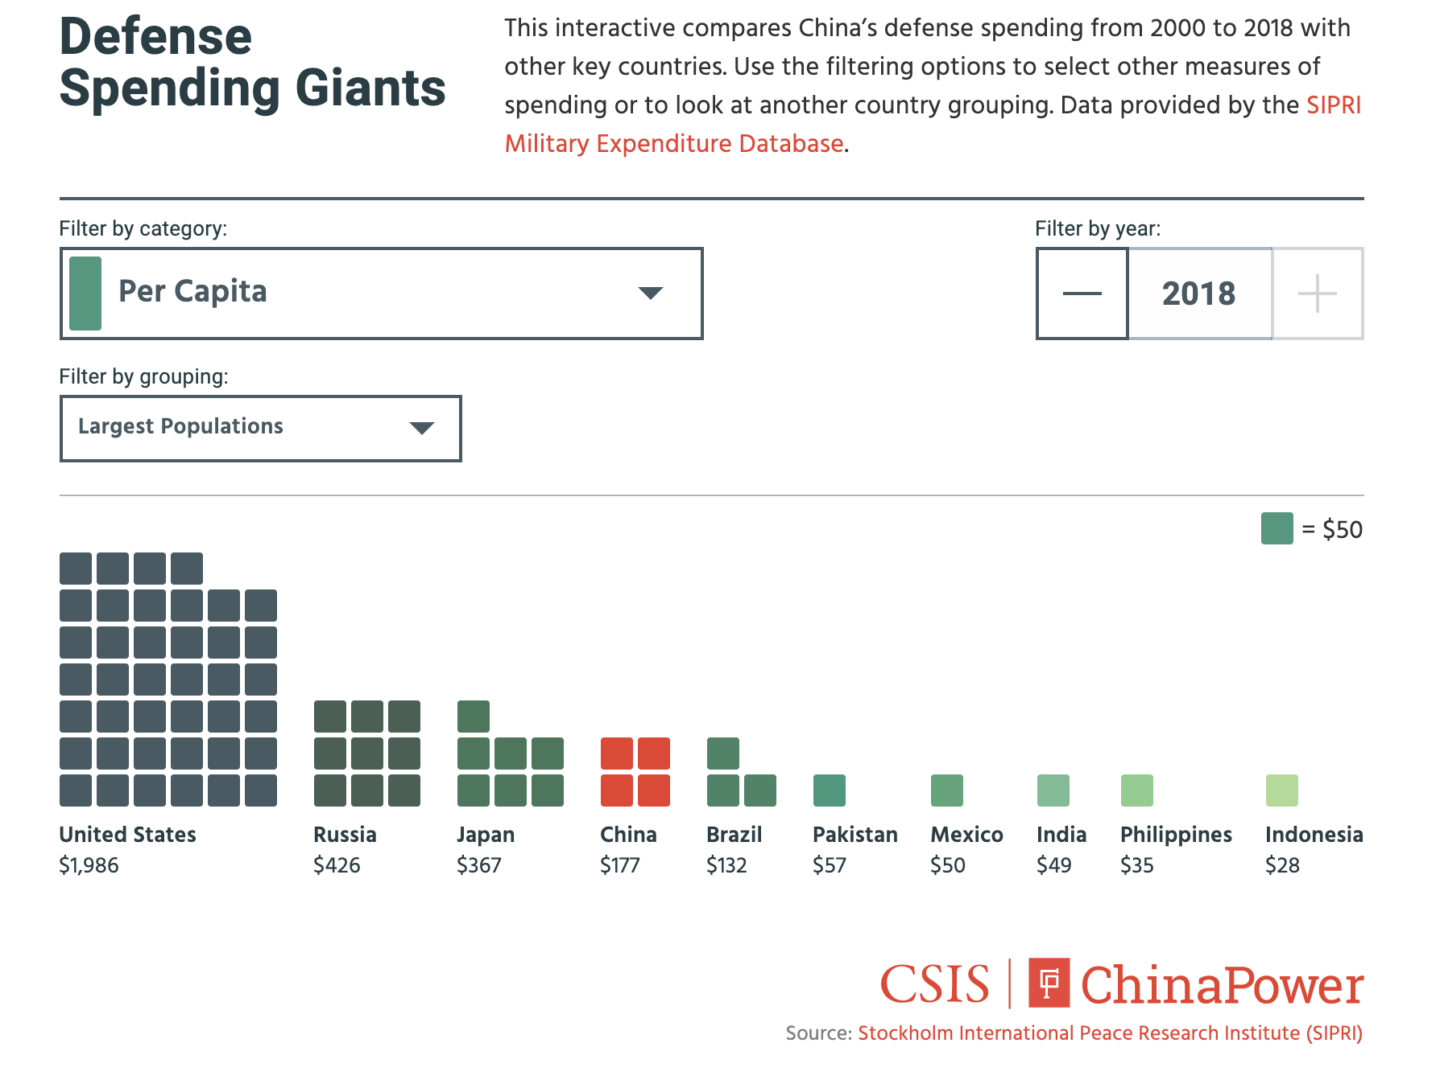
WE CUSTOM DESIGNED an original visualization using a volumetric comparison technique, category filters, and contextual metrics that allowed the user to slice the data in several ways like “spending per capita” or “percent of GDP.” We also worked closely with CSIS to create a strategy that grouped countries together for comparison that was contextually relevant, like “developing countries” or “China’s neighbors.” Once these categories were selected, users could then explore archival data dating all the way back to 2000 to see how spending has changed over time.
We looked into using a pre-existing code library or toolset, but no one had created a design like this one
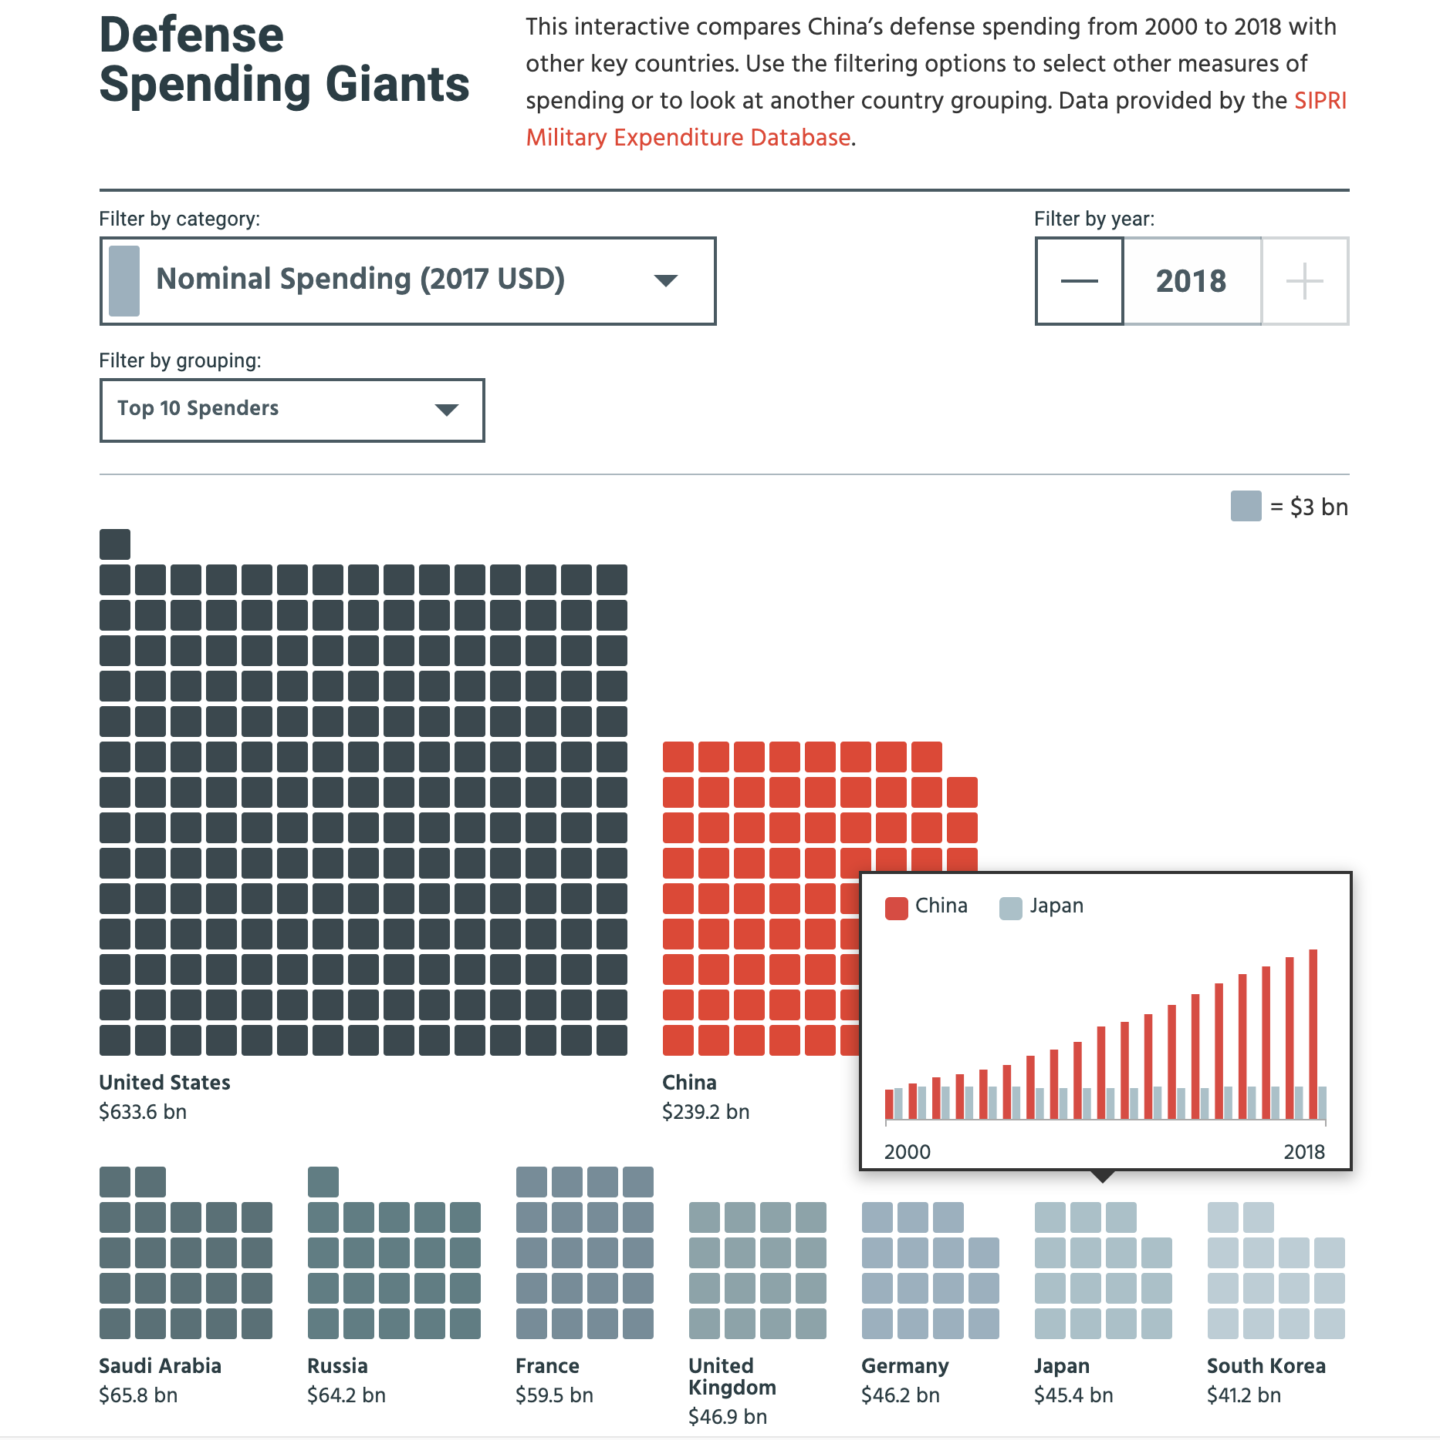
OUR GOAL was to allow users to see global, big picture data trends on military spending while also being able to do deep dives into country comparisons and change over time. We wanted to give users a lot of control, but also be able to learn and navigate the interactive quickly and easily. To accomplish this, we used a volumetric comparison that creates a dynamic and intuitive display of an enormous amount of data.
CODING the volumetric design was a challenge. It required us to build a custom back-end from the ground up using D3 and JavaScript. We looked into using a pre-existing code library or toolset, but no one had created a design like this one. We love a challenge and can’t resist custom back-ends because they allow us to do whatever we want!
SHORTLISTED for the 2019 KANTAR INFORMATION IS BEAUTIFUL AWARDS as part of the CSIS China Power data visualization package