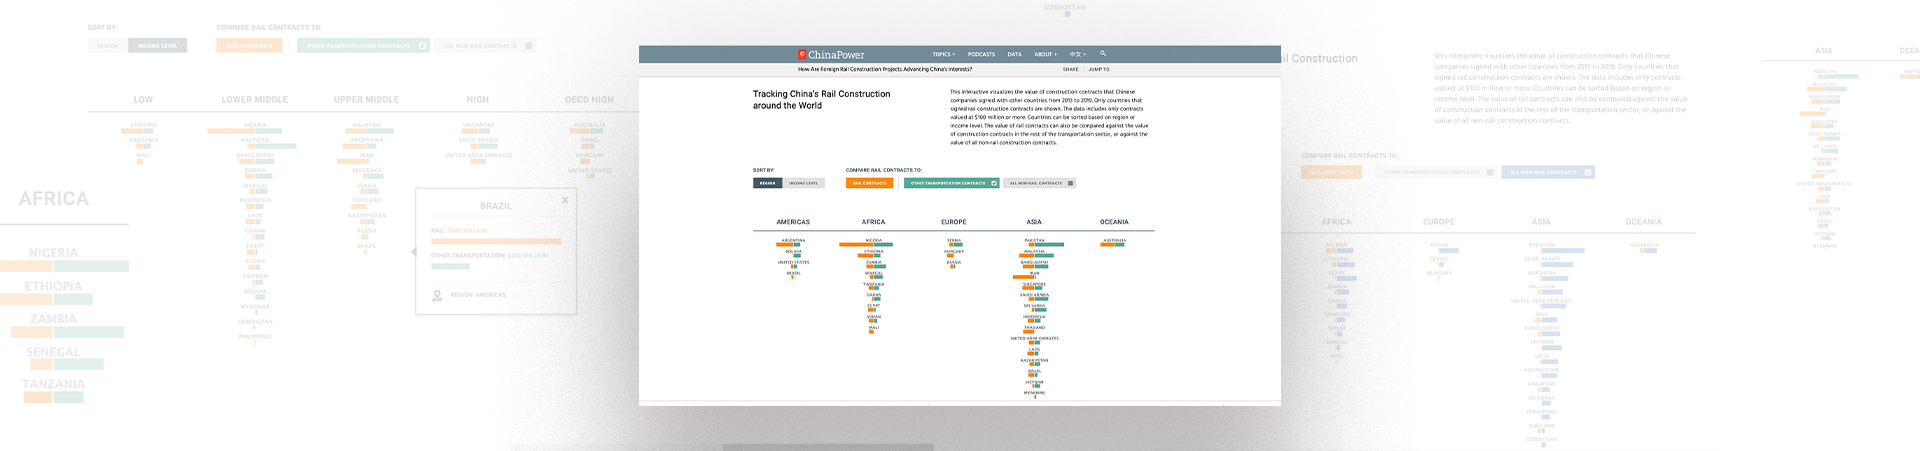
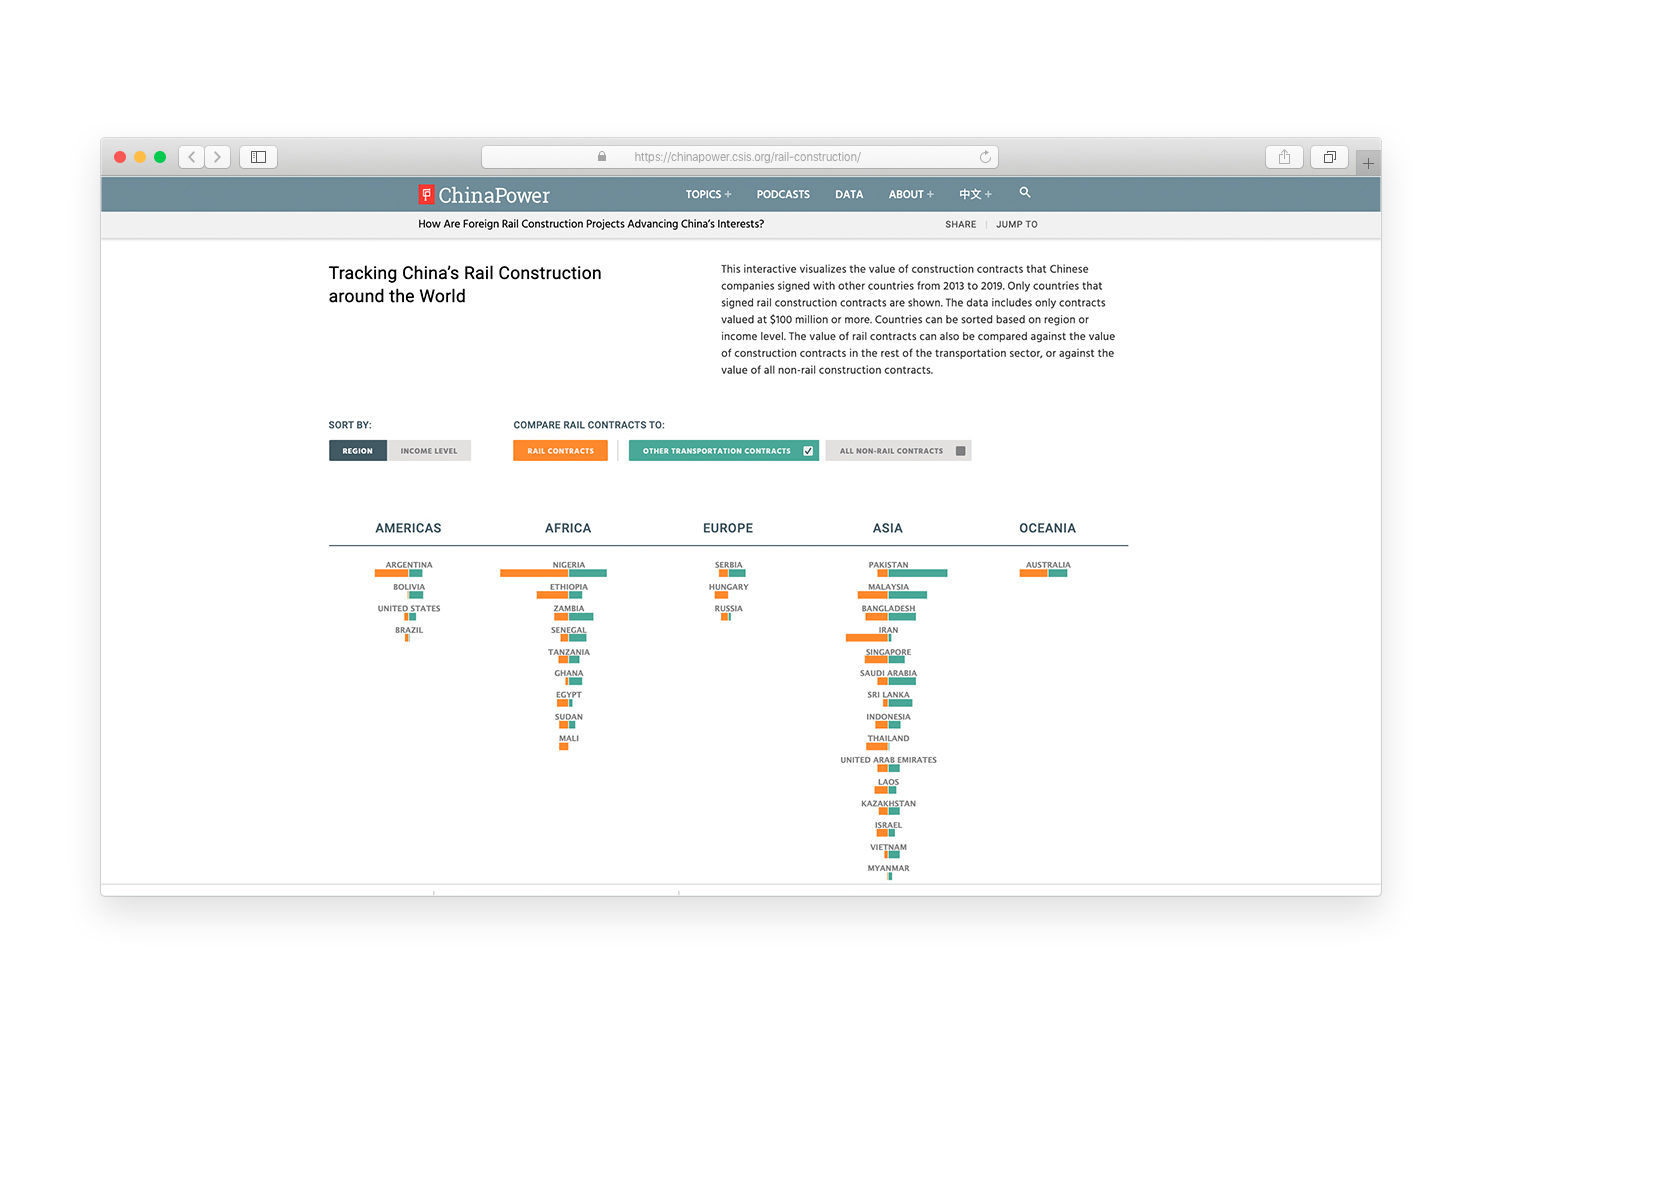
WE MADE an interactive data visualization that reveals the value of rail construction contracts Chinese companies signed with other countries from 2013 to 2019. The China Global Investment Tracker (CGIT) provided the data that contains detailed information on China’s investments abroad.
THE GOAL was to create an interactive data visualization that could display data that showed how much China invests in rail compared to other sectors and the rest of the world. The data needed to show specific numbers and create an interactive that showed big picture trends. To solve this, we create a custom embeddable data visualization where the user can compare rail contracts to other transportation contracts and non-rail contracts. CSIS also wanted users to be able to organize the data by different groupings, including geographic region and World Bank income level. By selecting either region or income level the user can compare the prices of various contracts.
The Challenge was to create a visualization that showed specific data around each country, while also allowing the user to see and understand birds-eye view trends by clicking the filters. We needed users to click a single button and gather key information on rail investment within seconds of viewing the data. We accomplished this by creating binary comparisons between rail and other transportation or non-transportation contracts. We then allowed big picture sorting by country income and region. The user can almost instantly see make conclusions about what kind of countries China is investing and where. The user can then hover over any bar to see specific details about that investment type, including how many billions of dollars went into each rail construction.

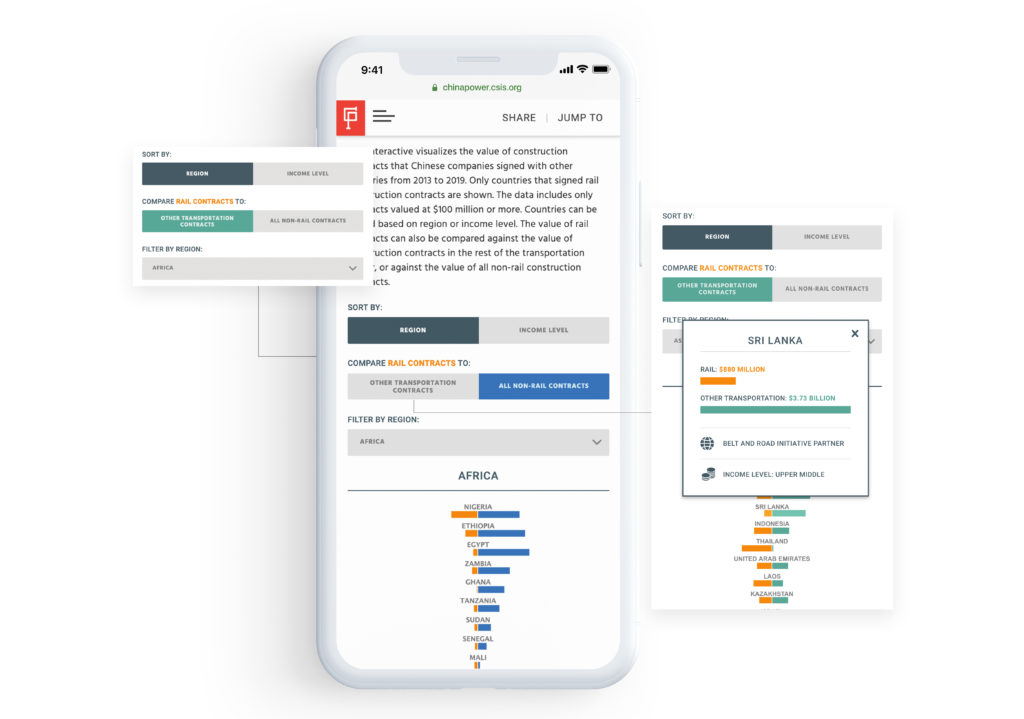
WE DESIGNED and coded the interactive in Javascript using the Highcharts library. The interactive is coded in an i-frame to make it easily embeddable anywhere on the CSIS website and can be easily shared with their partner organizations or alternative publishing platforms. It’s completely responsive for any size browser and resizes instantly to fit browser adjustments. Additionally we designed custom tablet and mobile, featuring a unique mobile-friendly stackable interface with drop-down filters.
The challenge was to create a visualization that showed specific data around each country, while also allowing the user to see and understand birds-eye view trends by clicking the filters.
THE PROJECT focuses on CSIS’s work around China’s rise in global economic and political influence. This project is part of their China Power series.